
Organized crime is changing its trafficking routes, under the cover of COVID-19. Timber smugglers in the Amazon are boosting their trade in the absence of supervision. Unemployment and alcohol dependency rates are jumping, and climate change continues unabated.
The world is changing rapidly — and at almost every level — in the shadow of the coronavirus pandemic, says Giannina Segnini, director of the Data Journalism Program at Columbia University in the United States.
But Segnini says data and tools are available to investigate and analyze these changes, and that reporters can track many of these shifts in real time, including changes in behavior.
“Listen, your grandchildren will be talking about the pre- and post-COVID-19 era. We are definitely witnessing a historical situation here,” she said in a June 18 webinar, part of GIJN’s series Investigating the Pandemic. “This thing is just starting. There are so many things happening across borders that are not being monitored. But there is data to monitor what is happening, and never before has data been a better tool to make sense of the world around us.”
A co-founder of The Latin American Center for Investigative Journalism (CLIP, for its acronym in Spanish), Segnini and her data scientist colleague at CLIP, Rigoberto Carvajal, shared insights on finding new data sources to investigate this new world.
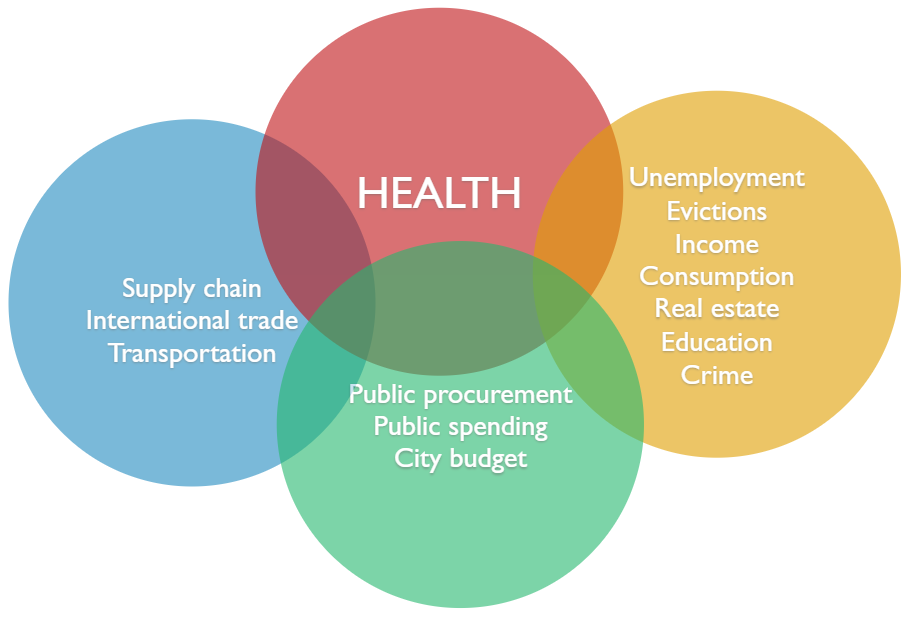
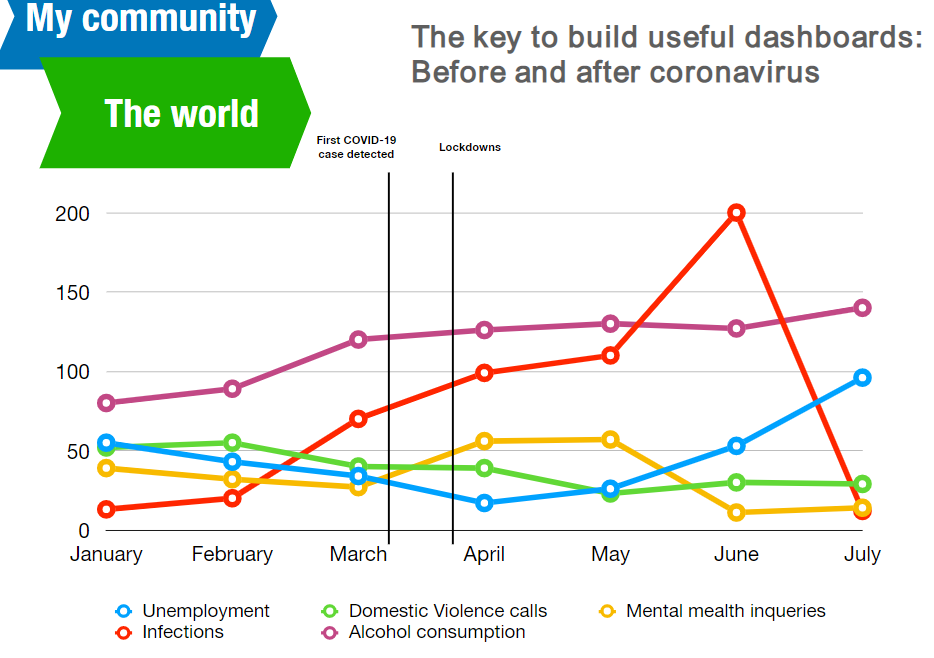
Beyond the direct health threats of COVID-19 and its fallout, Segnini said newsrooms could create data dashboards showing changes to ordinary life in their communities.
“Using automated data integration and standardized scales, you can imagine dashboards that reflect changes in variables like, say, traffic tickets, arrests, food prices, evictions,” she said. “All these changes are going to happen right away in society. And bad actors are taking advantage of the fact that we are all distracted by [the] coronavirus. Human trafficking and corruption is still happening, but they are changing routes and methods. There is destruction of supply chains. There are dramatic changes in shipping and airlines, with the travel restrictions.”
Segnini was previously head of the investigations unit at Costa Rica’s La Nación, and her team’s work led to the prosecution of more than 50 public figures, including three former presidents.
In his previous role with the International Consortium of Investigative Journalists, Carvajal was one of the data experts on the Panama Papers investigation.
Carvajal said COVID-19 case data provided by governments ranged from raw numbers and basic dashboards to downloadable, aggregated data — the most common form — and the best, but rarest, form: granular, case-by-case data. Within Latin America, he said, Mexico, Colombia, and Peru stood out as countries offering the richest case data.
“The best way to get rich visualization of knowledge from datasets is to mine granular data, with individual [anonymized] records for each patient [case],” said Carvajal.
He said it was important to use “ETL” programs (extract, transform, load) to automatically import that data into dashboards or visualizations because of its sheer volume. He uses an open source tool, Talend Open Studio, for data integration.
by Rowan Philp, International Journalists’ Network
Related posts
Magazine Training International’s mission is to encourage, strengthen, and provide training and resources to Christian magazine publishers as they seek to build the church and reach their societies for Christ.